Conversion Attribution for Social Media – Step by Step Instructions
This past week I had the pleasure of attending the #IFA2016 (International Franchise Association) conference in San Antonio, TX. This was CallTrackingMeterics 3rd time exhibiting at the show; it was exciting to meet so many of our current clients and to have the opportunity to demonstrate our call tracking solution to other franchises. During my quick trip to Texas, I was able to visit the historic Alamo, and enjoy some of the best Tex-Mex food around, I was also fortunate to be able to attend a session on social media.
The session was titled: Driving Brand Consistency Across Social Media from Infancy to Scale. The panel of presenters included the CEO of Manalto, the COO of Fishman Public Relations & the President of Tutor Doctor (a CTM Customer by the way!). The presentation covered current trends like how Snapchat is the fasting growing social network and how brand consistently across all social networks is vital for establishing trust. There are so many fake social pages out there, because of this it’s crucial for your brand to remain consistent throughout all them to establish trust that this is, in fact, your brands page and not a knock off. It was surprising to see examples of large franchises like the Hilton and FedEx, whose brands are not even close to consistent throughout their social networks with different color logos, clearly different writing styles and content. These inconsistencies make it hard for a user to trust the page is who and what it’s claiming to be, because of these inconsistencies the user is likely to not interact with the content.
One of the most interesting facts I took away from the session is that the ability to demonstrate ROI is the largest factor when it comes to making decisions. Surprisingly, about 75% of the room raised their hand when they asked: “who wasn’t able to attribute social media to actual sales.” Seems strange that 100% of the businesses in the room also said they have a social media presence and consider it to be an important part of their franchises marketing strategy. Yet, they aren’t able to attribute social media to actual sales?
![]()
![]()
This all seems like a big contradiction; it appears most businesses are jumping on the social media bandwagon but aren’t taking the proper steps to track and attribute sales to the networks. Which is a shame because paid followers doesn’t necessarily equal new customers. 10 million facebook followers will do wonders for your SEO rankings but doesn’t mean much to your bottom line if you’re not generating new sales.
There are several platforms to help you measure and track the ROI on your social media networks, I’m going cover Google Analytics social reports. I will note that CallTrackingMetrics offers ROI reporting, you can learn more about CTM’s call ROI reports here.
How to track the ROI of your Social Networks in Google Analytics
Google Analytics provides you with data that allows you to monitor where your website visitors come from and helps you understand how your visitors interact with your websites content. Google Analytics also provides you with tools to adequately track and measure your social media initiatives and prove the ROI of your social media efforts. To accomplish this, your first step is to understand your social media objectives.
1) Establish social media goals for you company
It may seem strange that this even needs to be addressed, however, it is all too common for companies to jump on the social media bandwagon without establishing an overall goal or expected outcome. How can you measure the success of your campaign if you can’t define what success is?
2) Set up goals in Google Analytics
Tracking the true effectiveness of social media for your company goes beyond pageviews and visits. Discovering if social media actually helps your business is more important if you’re trying to prove the ROI of social media. Knowing important metrics like: product sign ups, leads, downloads, and purchases, will help you solidify the importance of social media for your business. To create Goals follow these steps by Google Analytics. Here’s an example of a social media destination URL goal, the goal is configured to complete whenever a visitor request a demo and came to the page from a referring social site.
![]()
3) Access Social Analytics Reports
Analytics provides several reports on social networks, to see the social reports navigate to the Reporting tab> Select Acquisitions > Social.
- Overview Reports
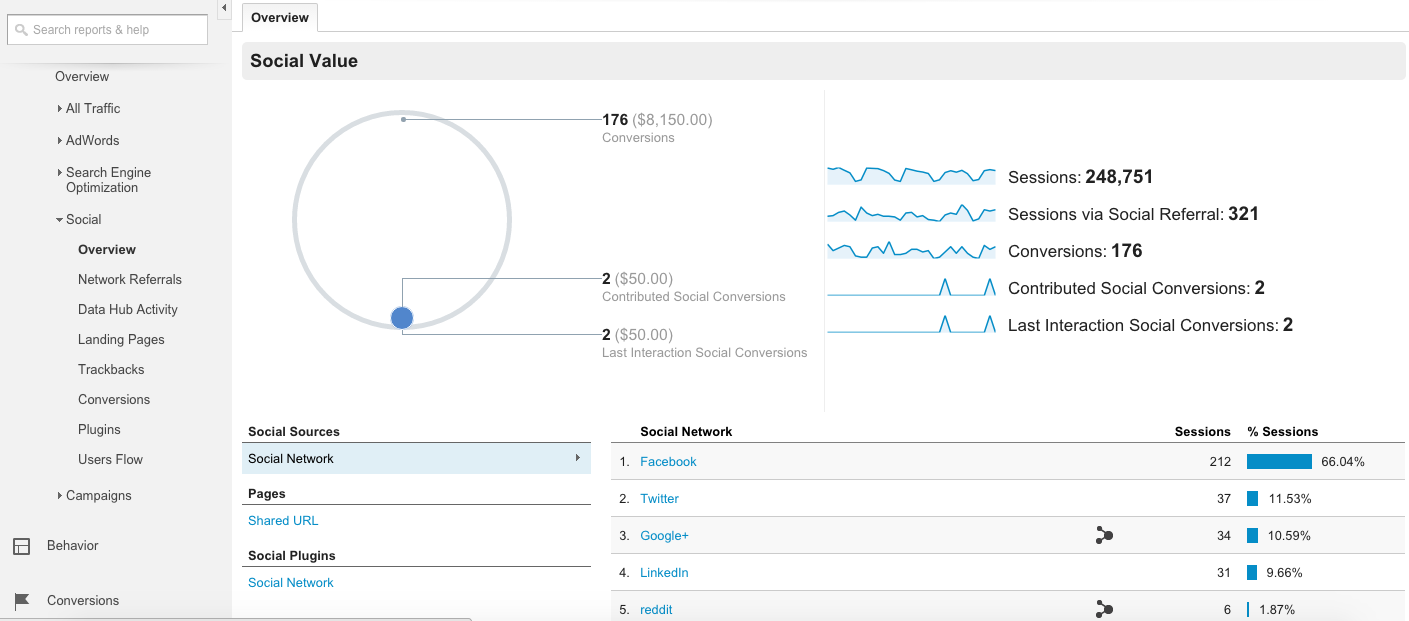
The Overview report allows you to see at a glance how much conversion value is generated from social channels. The Social Value graph compares the number and monetary value of all goal completions versus those that resulted from social referrals.
- Network Referral
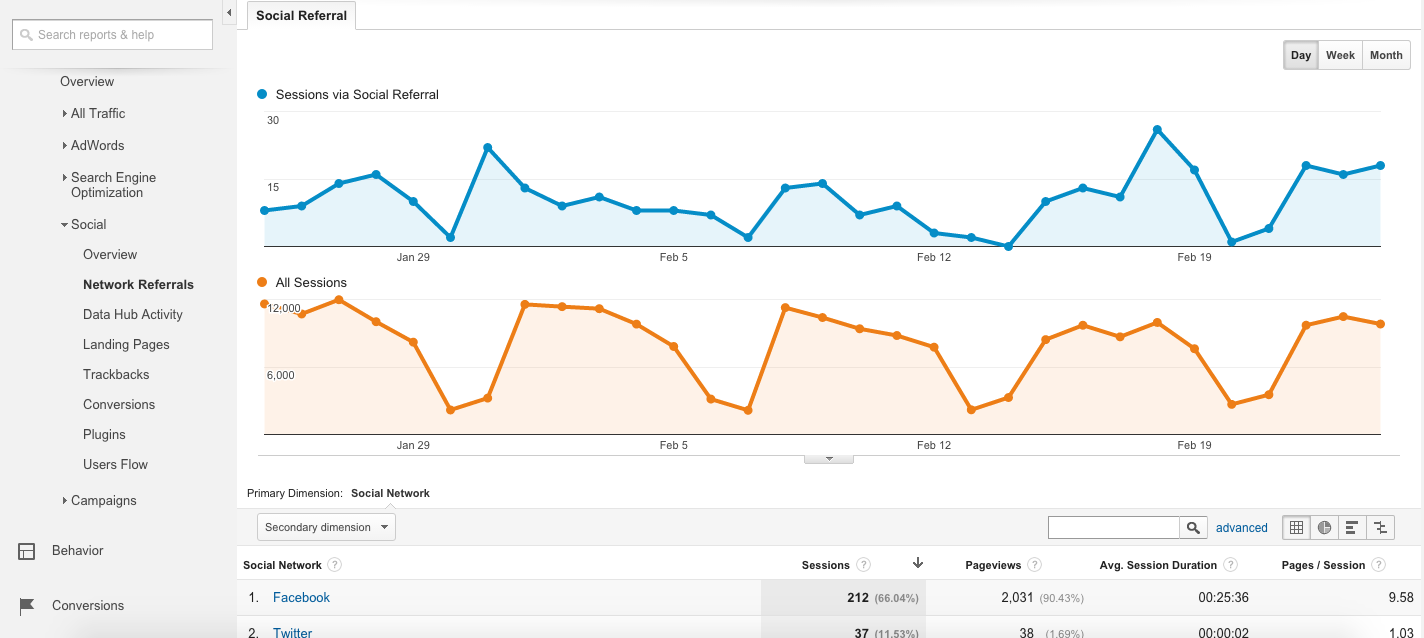
This report allows you to see which social networks referred the highest quality traffic. For example, you may wish to increase your investment in the social networks that referred fewer sessions but higher quality traffic.
- Data Hub Activity
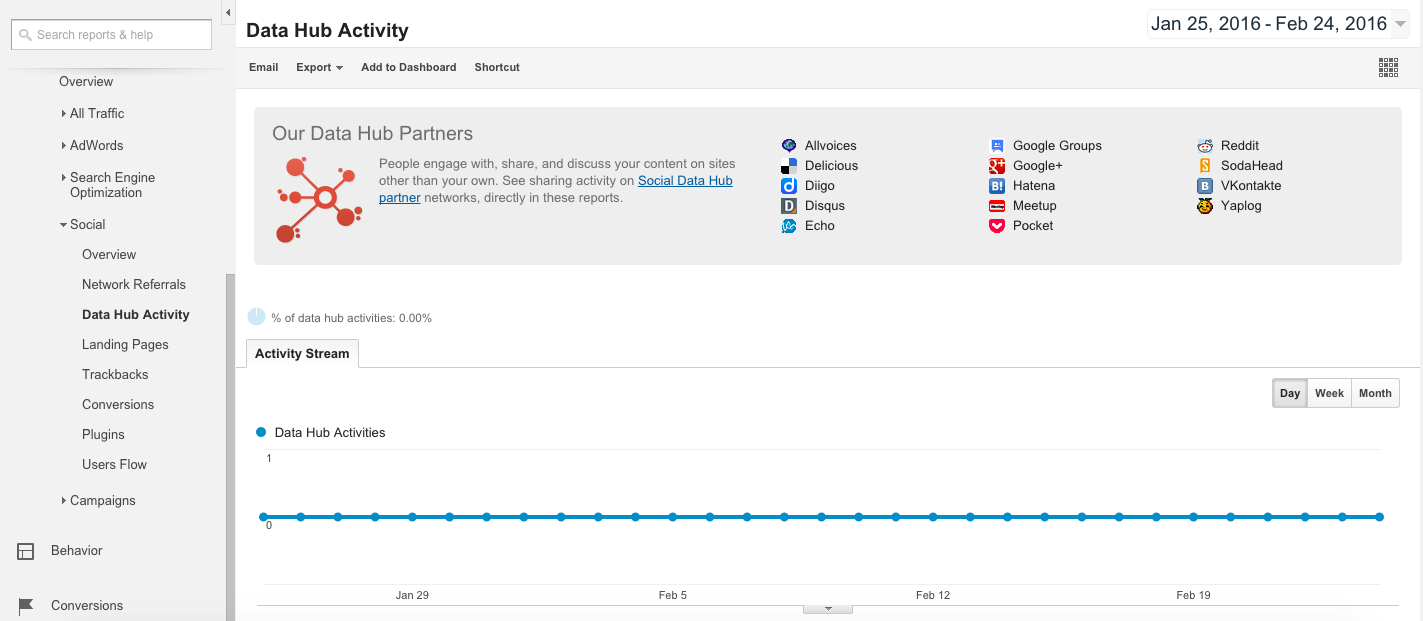
The Data Hub Activity report shows you how people are talking about and engaging with your site content on social networks. You can see the most recent URLs people shared, how and where they shared (via a “reshare” on Google+, for example), and what they said.
- Landing Pages
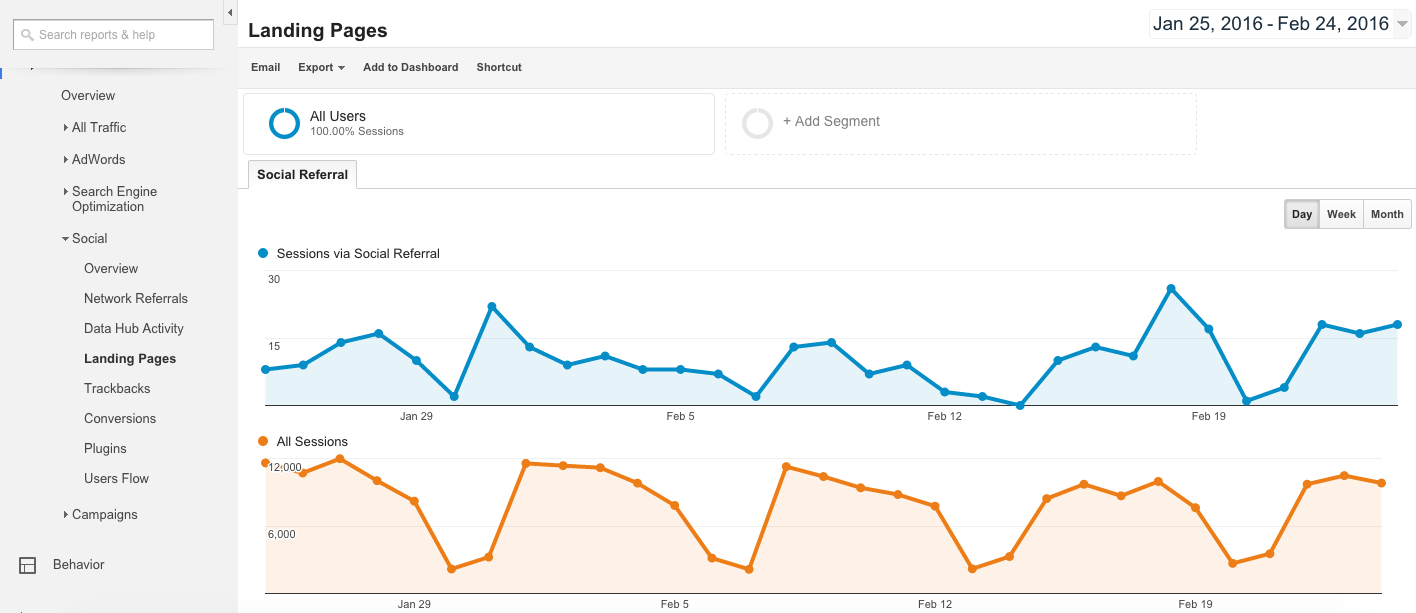
Navigate to Landing Pages to see engagement metrics (Pageviews, Avg. Session Duration, Pages/Session) for each URL. Sort by Data Hub Activities in the table to identify your most viral content.
- Trackbacks
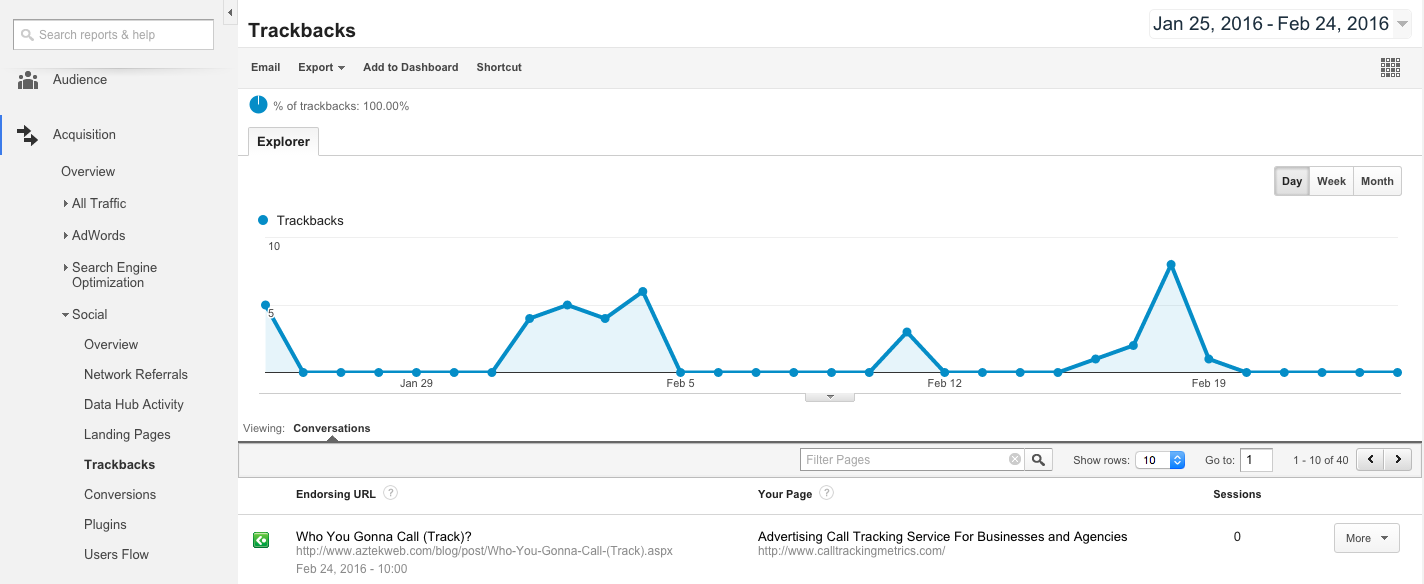
The Trackbacks report shows you which sites are linking to your content, and in which context. This can help you replicate successful content and build relationships with those users who frequently link to your site.
- Conversions
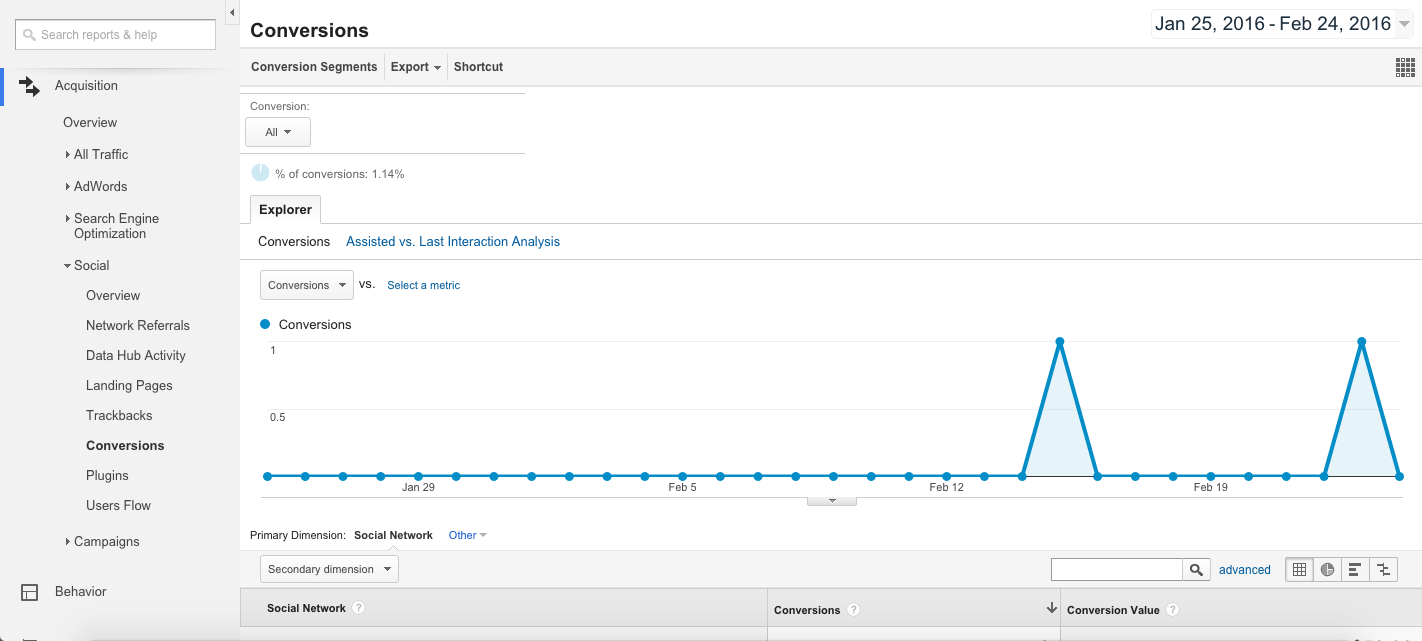
The Conversions report allows you to quantify the value of Social. It shows the total number of conversions and the monetary value of conversions that occurred as a result of referrals from each network.
- Plugins
If you have Google “+1” and Facebook “Like” buttons on your site, it’s important to know which buttons are being clicked and for which content. For example, if you publish articles on your site, you’ll want to know which articles are most commonly “liked” or shared, and from which social networks they’re being shared (for example, Google+ or Facebook).
- Users Flow
The Social Visitors Flow shows the initial paths that users from social networks took through your site. For example, if you run campaigns that promote specific products, you can see whether users from each social network entered your site through these product pages and whether they continued on to other parts of the site or whether they exited. Hover over a source (Google+, for example) on the chart and select View only this segment to focus on traffic from that source.