[Research Study] A Data-Driven Approach to Optimizing ROAS/Lead Value with CallTrackingMetrics
In today’s digital age, tracking the return on investment (ROI) from various marketing channels is crucial for making business decisions. CallTrackingMetrics has helped deliver those insights for BAM Advertising & Marketing and their clients.
BAM is a Pittsburgh-based marketing agency with clients across the United States whose primary focus is lead generation for home service and trade companies. They even have their own proprietary lead tracking software – The BAM Lead Tracker (BLT) – that their clients use to track leads, appointments, and sales.
Using data from CallTrackingMetrics’ dynamic number insertion (DNI) on websites as well as static tracking numbers for other channels, BAM can accurately track which of their efforts are making the phone ring right in the BLT platform, where each caller is assigned the status of new or current customer.
This research study takes a deep dive into how BAM Advertising uses data from CTM to unlock hidden opportunities and insights for their clients.
The Value of Tracking Leads and Return on Ad Spend (ROAS)
Because of CallTrackingMetrics + BLT Integration, BAM can track not just lead volume, but lead value on client phone calls across channels.
BAM tracked over $106,500 in ROAS specific to Client A’s paid search campaigns via calls from CTM which, when combined with form data, generated a 13.3:1 ROAS for search. In other words, for every dollar spent, the client earned over $13 in revenue.
If you are an account manager or owner of a micro-agency involved in Paid Search – or any digital marketing channel – the insights you can get from call tracking are incredibly powerful and valuable in a number of ways:
- Gaining valuable insights into performance
- Analyzing and optimizing current marketing strategy & channel tactics
- Explaining the data to clients in a language they want to understand (money!)
- Establishing revenue adjacency from marketing executions to client’s bottom line
The Goals – Channel Comparison
This report focuses on a six-month study of CallTrackingMetrics data for one client in two major metropolitan area locations. This client is a national brand with franchisees across the United States. The report will delve into the performance of different channels in terms of both quality and quantity of phone calls.
The goal of this report is to glean insights into which channels:
- Drive total call volume
- Drive current customer inquiries
- Drive leads
Methodology
The data used for analysis includes:
– **Current Customer Calls**: Number of calls from existing customers
– **New Customer Calls**: Number of calls that resulted in a new customer (qualified lead)
– **Total Unique Calls**: Total number of unique calls received – phone calls from one specific number regardless of the number of calls made from it.
For each metric above, the analysis looked at the source of each call from this list of channels:
- Email marketing
- Social media – Organic
- Social media – CPC
- NextDoor
- Website (undefined)
- Website – Organic
- Website – Google Ads
- Website – Bing Ads
- Google Ads Extension
- Bing Ads Extension
Setup and Data Entry
BAM uses CallTrackingMetrics’ API, which offers developers easy integration to customer tools. Since the BAM Lead Tracker is not an enterprise software system, this is crucial to establish a simple stream of data acquisition from tracking calls into the BLT dashboard.
The Data
Client A:
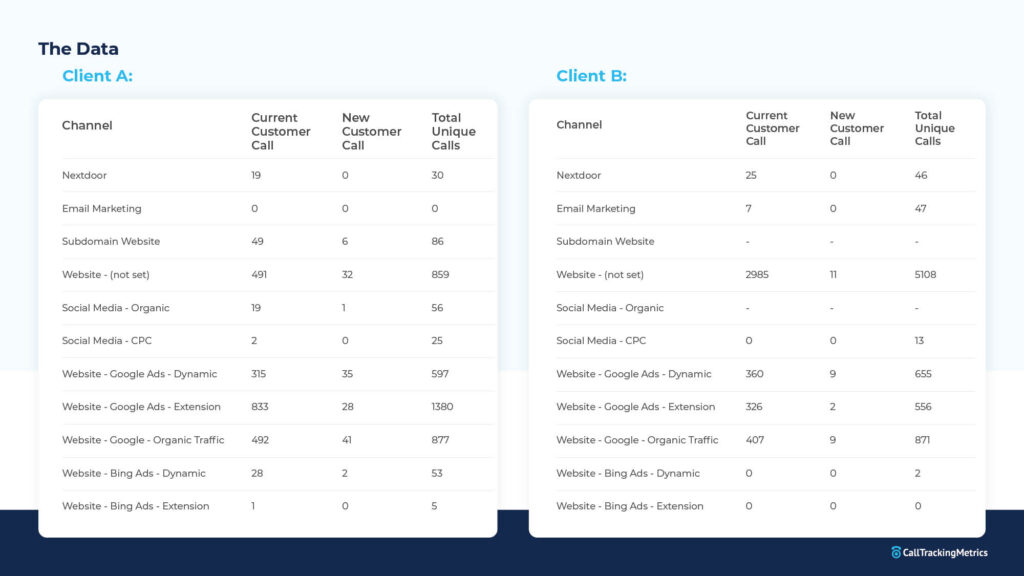
Exhibit A: New Customer Calls
It would be important to examine, first and foremost, which channel directly drives the most qualified leads. Channels that have the most new customers, should be studied further in Google Analytics and re-optimized. For example, which pages on the website are driving the most calls based on the channel? Is there a particular type of content or subject matter that is driving more phone calls from this channel? You can get these insights from your GA4 Dashboard. For channels that are driving the least amount of new customers, the questions should be asked “Why”, and “What can be done about it”?
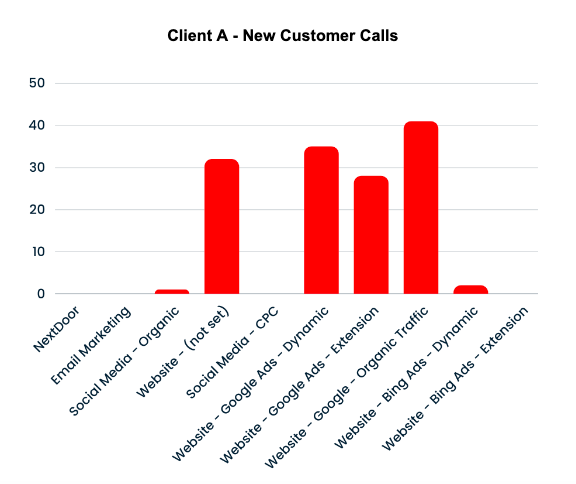
Client A – New Customer Calls
Most New Customers
- For client A, the channel with the most new customers is “Website – Google – Organic Traffic” with 41 new customers. This indicates that organic traffic from Google is a significant driver for acquiring new qualified leads.
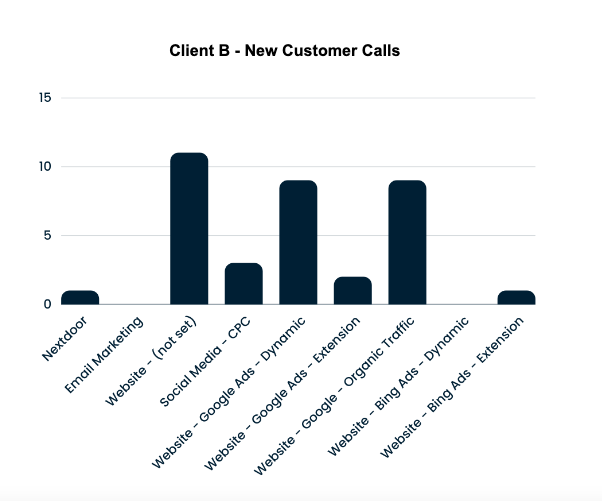
- For client B, the channel with the most new customers is “Website – (not set)” with 11 new customers. This suggests that this channel is the most effective in acquiring new qualified leads in this metropolitan area.
Least New Customers
- For Client A, the channels “NextDoor,” “Email Marketing Nurture,” and “Social Media – CPC” had zero new customers. These channels may require re-evaluation to improve their performance.
- For Client B, the channels “Nextdoor,” “Email,” “Social Media – CPC,” “Website – Bing Ads – Dynamic,” and “Website – Bing Ads – Extension” had zero new customers. These channels may need to be re-evaluated.
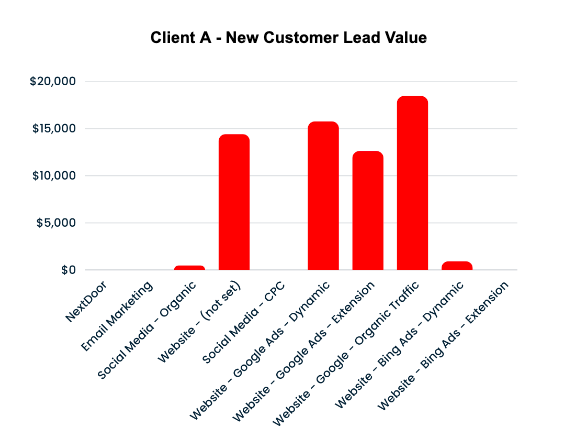
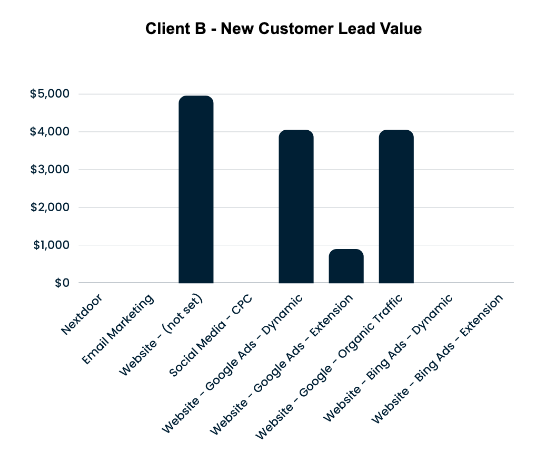
Exhibit B: Total Unique Calls
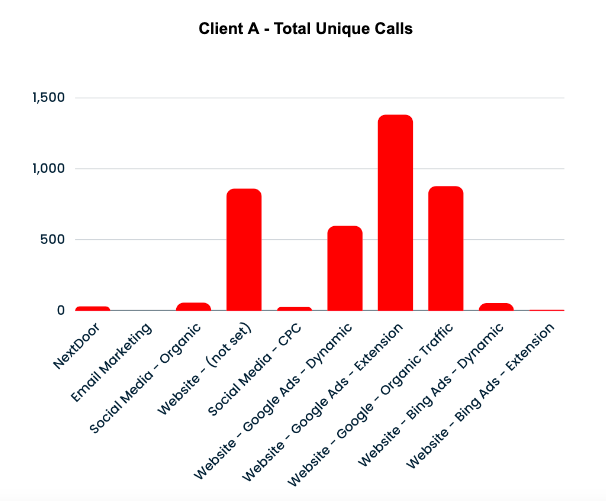
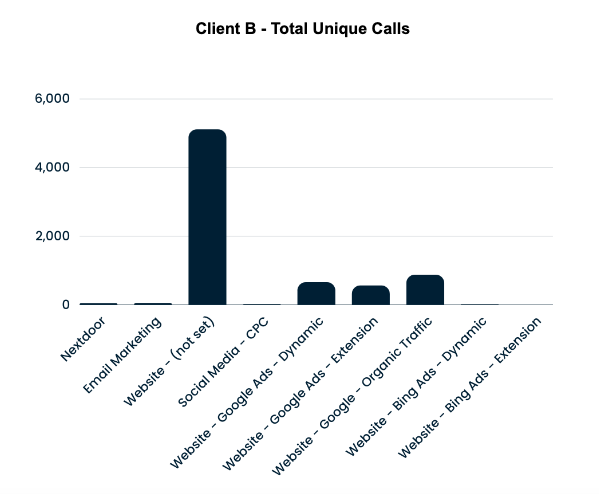
We would also want to know which channel drives the most unique calls – which would be phone calls from one specific number regardless of the number of calls made from it. Think of this as a unique user visiting a website – they can log as many sessions as they want, but they are still only one user. This is an indicator of potential performance, though volume doesn’t always equal success. Channels that have lots of unique calls, regardless of customer type, should be examined to see how they are converting, and if they could convert at a higher rate than they are now. Conversely, channels with few unique calls may be lacking in effectiveness for a variety of reasons, including quality and technical issues. They should be examined.
Most Unique Calls Total
- For Client A, the channel “Website – Google Ads – Extension” had the most unique calls with a total of 1,380. This suggests that it is the most engaged channel, although it may not be the most effective in terms of quality.
- For Client B, the channel “Website – (not set)” had the most unique calls with a total of 5,108, indicating high engagement.
Client B – Total Unique Calls
Least Unique Calls Total
- For Client A, the channel “Email Marketing Nurture” had the least unique calls with zero, indicating a lack of engagement and effectiveness.
- For Client B, the channel “Website – Bing Ads – Dynamic” had the least unique calls with only 2, indicating a lack of engagement.
Exhibit C: New Customer To Current Customer Call Ratio
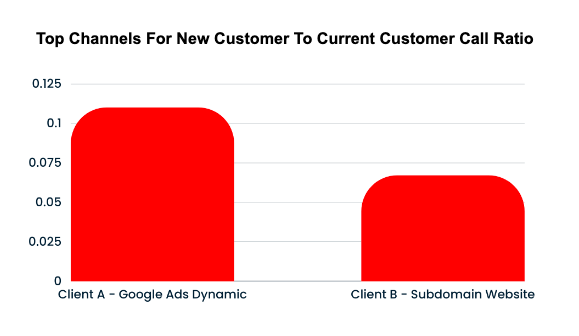
Many channels had zero calls from current customers, indicating that they are not being used to drive current customer calls. This is ok, and good to know. What is interesting is to cross-compare channels that have higher volume calls for both new and current customers. A higher ratio of new customers to current customers is a leading indicator of a channel’s success.
Top Channels For New Customer To Current Customer Call Ratio
How do they differ from Client A to Client B?
- For Client A, the channel “Website – Google Ads – Dynamic” had the largest new customers to current customer call ratio with .11.
- For Client B, the channel “Subdomain Website” had the largest new customers to current customers call ratio with approx 0.067.
Additional Insights From Data
- Despite “Website – Google Ads – Extension” having the most unique calls for Client A, it is not the most effective in converting these into new customers.
- The “Subdomain Website” has a relatively high number of unique calls (86) but low new customer calls (6), suggesting an opportunity for optimization.
- Cost-Effectiveness: Considering the average value of a qualified lead is $450, channels like “Website – Google – Organic Traffic” offer a high ROI for Client A, while Google Ads offer a reasonable ROI for Client B.
- “Zero engagement” Channels like “Social Media – CPC” and “Website – Bing Ads – Extension” might need to be looked at for optimization. They may be still driving engagement but something is missing e.g. UTM tagging. The Bing Ads extension for Client B should be re-examined.
Action Items From Client Data
Focus on High ROI Channels:
- Allocate more resources to channels like “Website – Google – Organic Traffic” that have been shown to provide a high ROI. Local SEO, blogs, link building, directories, and other publishing initiatives on owned media sites can continue to boost website traffic and performance.
- Look at the Paid Ad performance and see which ads are driving results – the copy, the content, the subject matter. Try similar ads in other service areas.
Examine/Optimize Low-Performing Channels:
- Re-evaluate the strategies for “NextDoor,” “Email Marketing” and “Social Media – CPC”. Is performance an issue or is there a technical problem with UTM tags? These are shared and paid media entities on third-party platforms such as Facebook and Mailchimp. They may require a better digital conversion funnel to be built with new UTM tags.
Cross-Comparison of the Two Data Sets
It would be remiss to not compare the two data sets and take a look at their obvious differences. While both clients have the same brand and offerings, a variety of factors can influence the outcomes of each. One glaring difference is the disparity in data entry sets for Client B compared to Client A…is this a problem, or just the way each organization runs things?
These are questions marketers need to ask their clients to get a better understanding of how they operate. It may be nothing, but if it ever could be something…always worth it to ask.
Similarities
- Both data sets have channels with zero new customers, such as Nextdoor and Social Media – CPC.
- Both areas have channels with high unique calls but low new customer calls, like Website – (not set).
Differences
The top-performing channel in terms of new customers is different. For client A, it’s Website – Google – Organic Traffic. For Client B, it’s Website – (not set).
The new customer to current customer ratio is different – as discussed above.
Insights and Action Items
- Localize the strategy. Different metropolitan areas may require different channel strategies. Focus on what works for each specific area.
- Universal optimization. Channels that perform poorly in both areas should be re-evaluated universally.
- Resource reallocation. Consider reallocating resources from low-performing to high-performing channels based on the data from both areas.
Conclusion
Understanding the ROI and ROAS from ad spend and different channels is crucial for optimizing marketing strategies. This report provides a comprehensive analysis of CallTrackingMetrics, offering valuable insights and action items for improving ROI.
By focusing on both the quality and quantity of phone calls, businesses can make data-driven decisions to allocate resources more effectively, ultimately leading to increased ROI and customer satisfaction. Learn more about BAM or CallTrackingMetrics’ solution today and improve your ROAS tomorrow!